The Good Experimental Design toolkit
Some templates and checklist to level-up your experimental design.

Ronald Fisher, father of modern experimental design, taught us experiment data is only as good as the design you put into it.
This calls-to-mind a common mantra among data scientists and software engineers: “Garbage in, garbage out.” If the experiment has a poorly designed hypothesis—even if the test is randomized and controlled—it gives you garbage evidence. If your hypothesis is sound, but the math is bad, again—garbage data. To avoid creating garbage, follow the templates in the “The Good Experimental Design Toolkit.”
It contains four process templates, each with its own overarching theme to guide your approach.
1. Hypothesize: Design Like You're Right
“Design Like You’re Right” reflects the confidence you must have in the idea in order to test it in the first place. In the first template, shown in Figure 1 below, you define the…
- Baseline State.
The current situation or default state of affairs that you will stubbornly stick to unless proven otherwise. You must observe very convincing evidence to be swayed away from the baseline state to a new default. - Research Insight.
The research observation that inspired a testable idea that will challenge the baseline state. - Customer Problem Statement.
What you believe negatively impacts your customer as they try to achieve their goal and how solving the problem might create customer value. - Variant.
Your testable idea that will challenge the baseline state. - Prediction.
What you think will happen when the change is exposed to visitors. It’s your proposed “solution” to the customer problem. - Variables.
The things that may influence the outcome of your experiment. You must “manipulate” the variables so that you can determine “causality” between the change you made and the effect it had. Your variables help you draw reliable conclusions that you can learn from.
![The hypothesize template "Design like you're right" Baseline
State The current state is... [description of base]. Research Insight: Based on... [research], [observation], or [evidence]... Variant: We believe that... [description of testable idea]. Problem Statement: This is a [problem or opportunity] because... [assumption about the value it can create]. Prediction: If, we [proposed change] to [independent variable(s)], then [expected impact] on [dependent variable(s)].](http://erindoesthings.com/wp-content/uploads/2024/05/hypothesize.png "The Hypothesize Template")
2. Validate: Test Like You're Wrong
“Test Like You’re Wrong” flips the Hypothesize hubris on its head by reiterating the extremely skeptical attitude you need when running a null hypothesis test. The second template, Validate in Figure 2 below, covers the following information:
- The Null Hypothesis Reminder.
This reiterates your skeptical mindset, meaning you will not accept a new belief unless there’s convincing evidence that sways you to believe otherwise. - Metrics & Math.
This outlines the exact evidence you’d need to observe to be convinced to reject the null hypothesis. - Test Type.
This clarifies if you’re aiming to make things better (with a “superiority test”), or if your goal is simply to not make things worse (with a “non-inferiority test”).
![The Validate Template "Test Like You're Wrong" The change is tested against the current state. The assumption is that the change has no effect. However, if the effect outlined in Metrics & Math is observed, we will... change our minds, reject the current state, and adopt the change as the new current state. Otherwise, we will reject the change and keep things in their current state. Metrics & Math This test is designed to find an impact on...
Blank goal metric at a... Blank % minimum detectable effect at a... Blank % significance level and a... Blank % statistical power after... Blank visitors, and... Blank run time. Test Type Superiority Non-inferiority Decision Moment Test will start on [insert date].
Test will stop on [insert date].
A decision will be made after the experiment runs for this pre-determined length of time.](http://erindoesthings.com/wp-content/uploads/2024/05/validate.png "The Validate Template")
3. Create: Make with Care
“Make with Care” reminds you that you never purely test an idea—you always test the execution of an idea. Bugs and poor design decisions can doom your idea right out of the gate, so execution quality is key. The third template, Figure A.3, covers the following information:
- Assumptions.
These are things you believe to be true that you have no evidence for. Making assumptions is a necessary part of learning because you cannot have evidence for every belief you hold. - Design Decisions.
Include any relevant information about the design decisions you made here. For example, explain why you chose a specific color that may deviate from a company color palette. The information you put here acts as a form of design documentation to help others learn about the execution of the idea you chose to test and why. - Development Decisions.
This block acts as your engineering documentation. Explain in this section what technology you used and why. For example, share what code language or tech stack you used.
![A template with blanks that you must fill in. Create: Make with Care Assumptions: In this experiment, we assumed... [insert assumptions that guided the implementation]. Design decisions: Because of these assumptions, we made these design decisions... [insert relevant design decisions]. Development decisions: To support the design, we made these engineering decisions... [insert relevant engineering decisions]. Empty spaces for screenshots of the baseline and the variant.](http://erindoesthings.com/wp-content/uploads/2024/05/Create.png "Create Template")
4. Decide: Do What's Right
“Do What's Right” forces you to consider the short- and long-term impact on all your stakeholders and the ethics behind your decision. The template in Figure 4 below reiterates the importance of finding the optimal outcome for everyone and everything impacted by the change.
Consider the following things as you fill out the fourth template:
- Stakeholder Benefits.
There’s no such thing as one “right” decision in experimentation. It’s your job to find the optimal path forward that ben- efits as many of your stakeholders as possible. This section defines your predictions about the impact the change you make affects. - Drivers & Guardrails.
These are the metrics you monitor to understand if you’ve changed customer behavior as intended and to ensure that no important business metrics are harmed. - Ethics.
This is a moment for teams to reflect on their motivations behind running the experiment. The act of signing one’s name to an experiment is based on cognitive behavioral science. People want to behave in-line with the image they have of themselves and willingly aligning with the ethics statement shapes behavior.
![A template that says, "Decide: Do What's Right." There are headings with sentences that have blanks, which need to be filled in. Skateholder benefits: This will be good for [stakeholder] because... This will be good for [stakeholder] because... This will be good for [stakeholder] because... Drivers & Guardrails We anticipate a [insert positive or negative change] effect on [driver metric]. We will not implement this change if it has [insert % of positive or negative change(s)] impact on [insert guardrail metric(s)]. Ethics: I, [your name], stand behind the ethics of this test, and I confirm that it is not
misleading discriminatory manipulative I understand that even if something is not illegal it can still be unethical. I am aware of biases that can influence my decisions, and I take ownership of the thinking and intent behind this experiment. At the bottom there is a place to sign the experimenter's name.](http://erindoesthings.com/wp-content/uploads/2024/05/decide-cropped.png "Decide Template")
Important note: These templates don't think for you.
They simply structure your thinking in a way that makes it easier to design a good experiment so you get high-quality data. Critical thinking, unbiased observation, and intellectual humility are all key to good decision making.
BONUS: When Good Ideas Fail checklist
You never purely test an idea. You always test the execution of an idea. That means an experiment might fail because of bad implementation, or some other unrelated reason. When you find yourself believing in an idea and you don’t understand why it’s done poorly, use the checklist below to uncover why.

These templates are a community effort. As such, they are available for use under a Creative Commons BY NC SA license. That means you can use them, build upon them, and adapt them—as long as you attribute the work to me, Erin Weigel, as well as these other contributors:
Craig Sullivan and his Hypothesis Template. Colin McFarland, Lukas Vermeer, Ya Zu, Ron Kohavi, Jane Murison, Kermin Zahirović, Rik Higham, Doug Hall, Michael Aagard, Molly Stevens, Cassie Kozyrkov, Kelly Wortham, and more!
The purpose of keeping these in a non-commercial realm is to allow the community to evolve and improve them together over time. That said, if you do adapt and evolve these templates—please let me know! I’d love to see where you take them from here so we can all learn and grow together. 😁

More useful resources
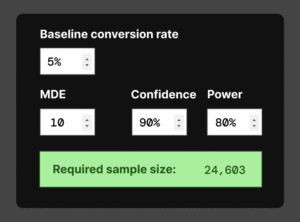
Frequentist sample size calculator
Use this frequentist sample size calculator to figure out how many people you need in each variant of your A/B test.
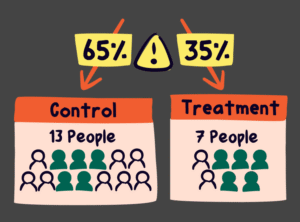
What you need to know about sample ratio mismatches (SRMs)
Randomization within experimentation is important. It’s how we isolate the change we aim to learn about. When randomization goes wrong, you can get an SRM.
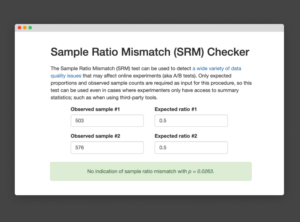
Lukas Vermeer’s manual sample ratio mismatch (SRM) checker
Randomization is the hidden power behind A/B testing. When randomized properly, the confounds in your data are completely removed. This allows you trust any cause/effect relationship you might observe.
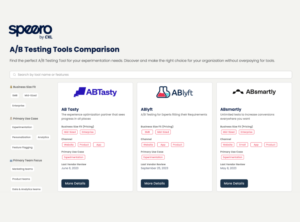
A/B testing tool comparison
Speero’s A/B testing tool comparison website Helping you find the right experimentation tool quickly and easily Speero’s A/B testing too comparison website includes a comprehensive list of options. If you’re […]