What you need to know about sample ratio mismatches (SRMs)
An infographic about SRMs and why they ruin your A/B test result data.

Check out these websites to help you detect sample ratio mismatches in your test results:
- Speero's A/B Testing Tools Comparison Website. Simple filter for tools with the feature "SRM" check. Learn more about the comparison tool here.
- Lukas Vermeer's SRM Checker. If your A/B testing tool doesn't have an automatic SRM check, you can do it manually with Lukas's calculator. Learn how to use the calculator here.
What to do if you spot a sample ratio mismatch (SRM)
What should you do if you observe an SRM?
- Check your experiment setup for bugs.
- Fix the bug(s) if you find any.
- Run the experiment again.
If you don’t find any bugs, rerun the experiment anyway. If you observe an SRM again, you missed a bug in your experiment setup. If you observe no SRM during the fresh run of the experiment, the data is likely OK. In that case, the SRM you observed was likely a false positive because Type I and Type II errors apply to SRM checks, too.
Experiment tracking and sample ratio mismatches
SRMs happen for all kinds of reasons. But they tend to crop up most with fancy JavaScript event tracking. This type of "frontend" tracking typically gets triggered “on-view” (when a certain thing becomes visible on the screen) or “on-click” (when a user interacts with a link, button, image, icon or whatever). When you track this way, sometimes the code doesn't run fast enough to track each person who may have been exposed to the experiment.
So, be very careful when you use frontend Javascript tracking (or “client-side” tracking). A more reliable way to track your experiments is with back-end tracking (or “server-side” or “software development kit (SDK)” tracking). Back-end tracking tends to be more reliable because it gets triggered immediately upon the page load request vs. whenever the Javascript happens to load. This means all people in the experiment get tracked vs. being missed because the Javascript doesn't load fast enough.
Learn more about the different types of tracking on Convert's blog.
More useful resources
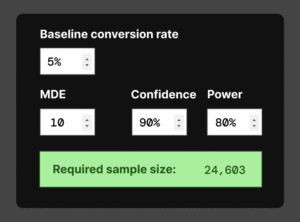
Frequentist sample size calculator
Use this frequentist sample size calculator to figure out how many people you need in each variant of your A/B test.
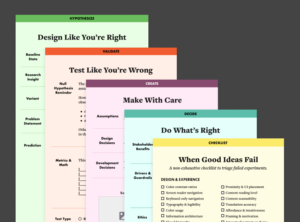
The Good Experimental Design toolkit
The Good Experimental Design toolkit templates and checklist level-up your experimental design. As Ronald Fisher learned, experiment data is only as good as the design you put into it.
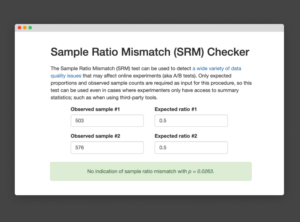
Lukas Vermeer’s manual sample ratio mismatch (SRM) checker
Randomization is the hidden power behind A/B testing. When randomized properly, the confounds in your data are completely removed. This allows you trust any cause/effect relationship you might observe.
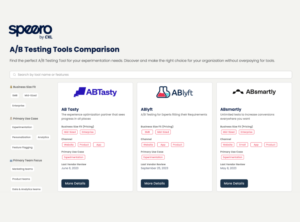
A/B testing tool comparison
Speero’s A/B testing tool comparison website Helping you find the right experimentation tool quickly and easily Speero’s A/B testing too comparison website includes a comprehensive list of options. If you’re […]